11. Arctic
Want to see the code? Click on the black boxes on the right to show/hide the code.
The International Arctic Buoy Programme (IABP) is a programme that maintains a large number of drifting buoys in the Arctic Ocean. These buoys are used to monitor the Arctic climate - you can find out more about the programme here.
They provide a dataset of buoy locations, along with their sensor readings (eg sea and air temperature etc), which we can use to visualise the distribution of buoys in the Arctic.
#First, we'll need to load a bunch of libraries so we can handle and view geospatial data
library('sf')
library(dplyr)
library('ggplot2')

# Now we'll load the buoy data and convert it to a spatial object
buoysRaw <- read.csv('./data/11/LEVEL1_2023.csv')
buoysRaw$id = as.character(buoysRaw$BuoyID)
buoys <- buoysRaw[buoysRaw$Month==12 & buoysRaw$Day==31 & buoysRaw$Lat > 50 ,] %>%
  group_by(id) %>%
  slice(1) %>% # or `slice_head(n = 1)` for dplyr v1.0.0+
  ungroup() %>%
  st_as_sf(coords = c("Lon", "Lat"), crs = 4326) %>%
  st_transform(crs=3995)

# Now we'll load the world borders data and crop it to the Arctic
wrld_simpl <- st_read('./data/11/TM_WORLD_BORDERS-0.2.shp', quiet = TRUE)
box = c(xmin = -180, ymin = 45, xmax = 180, ymax = 90)
sf::sf_use_s2(FALSE)
a = st_crop(wrld_simpl, box)
sf::sf_use_s2(TRUE)

w_sf <- a %>%
  st_as_sf(coords = c("long", "lat"), crs = 4326) %>%
  st_transform(st_crs(3995))

# Now we'll create a border and a frame for the map
border <- cbind(x = 0:360, y = rep(50, 361)) %>% st_linestring() %>%
    st_sfc(crs = 4326) %>% st_transform(st_crs(3995))

frame <- list(cbind(x = c(0:360, 360:0, 0), y = c(rep(50, 361), c(rep(0,361)), 50))) %>% st_polygon %>%
    st_sfc(crs = 4326) %>% st_transform(st_crs(3995))
The Map
Today’s map shows the locations of all the buoys on the final day of 2023 on an Arctic Polar Stereographic projection.
ggplot() +
  geom_sf(data = border, col="darkgrey") +
  geom_sf(data = w_sf, fill= "antiquewhite", color="darkblue")+
  geom_sf(data = frame, col="black", fill="white") +
  geom_sf(data = buoys, color="darkgreen")+
  coord_sf(xlim = c(-5288282, 5288282), ylim = c(-4078566, 4078566), crs = sf::st_crs("EPSG:3995")) +
  theme_void() +
  theme(axis.line = element_blank(),panel.grid.major = element_blank(), panel.grid.minor = element_blank(), panel.border = element_blank(), panel.background = element_rect(fill = "aliceblue"))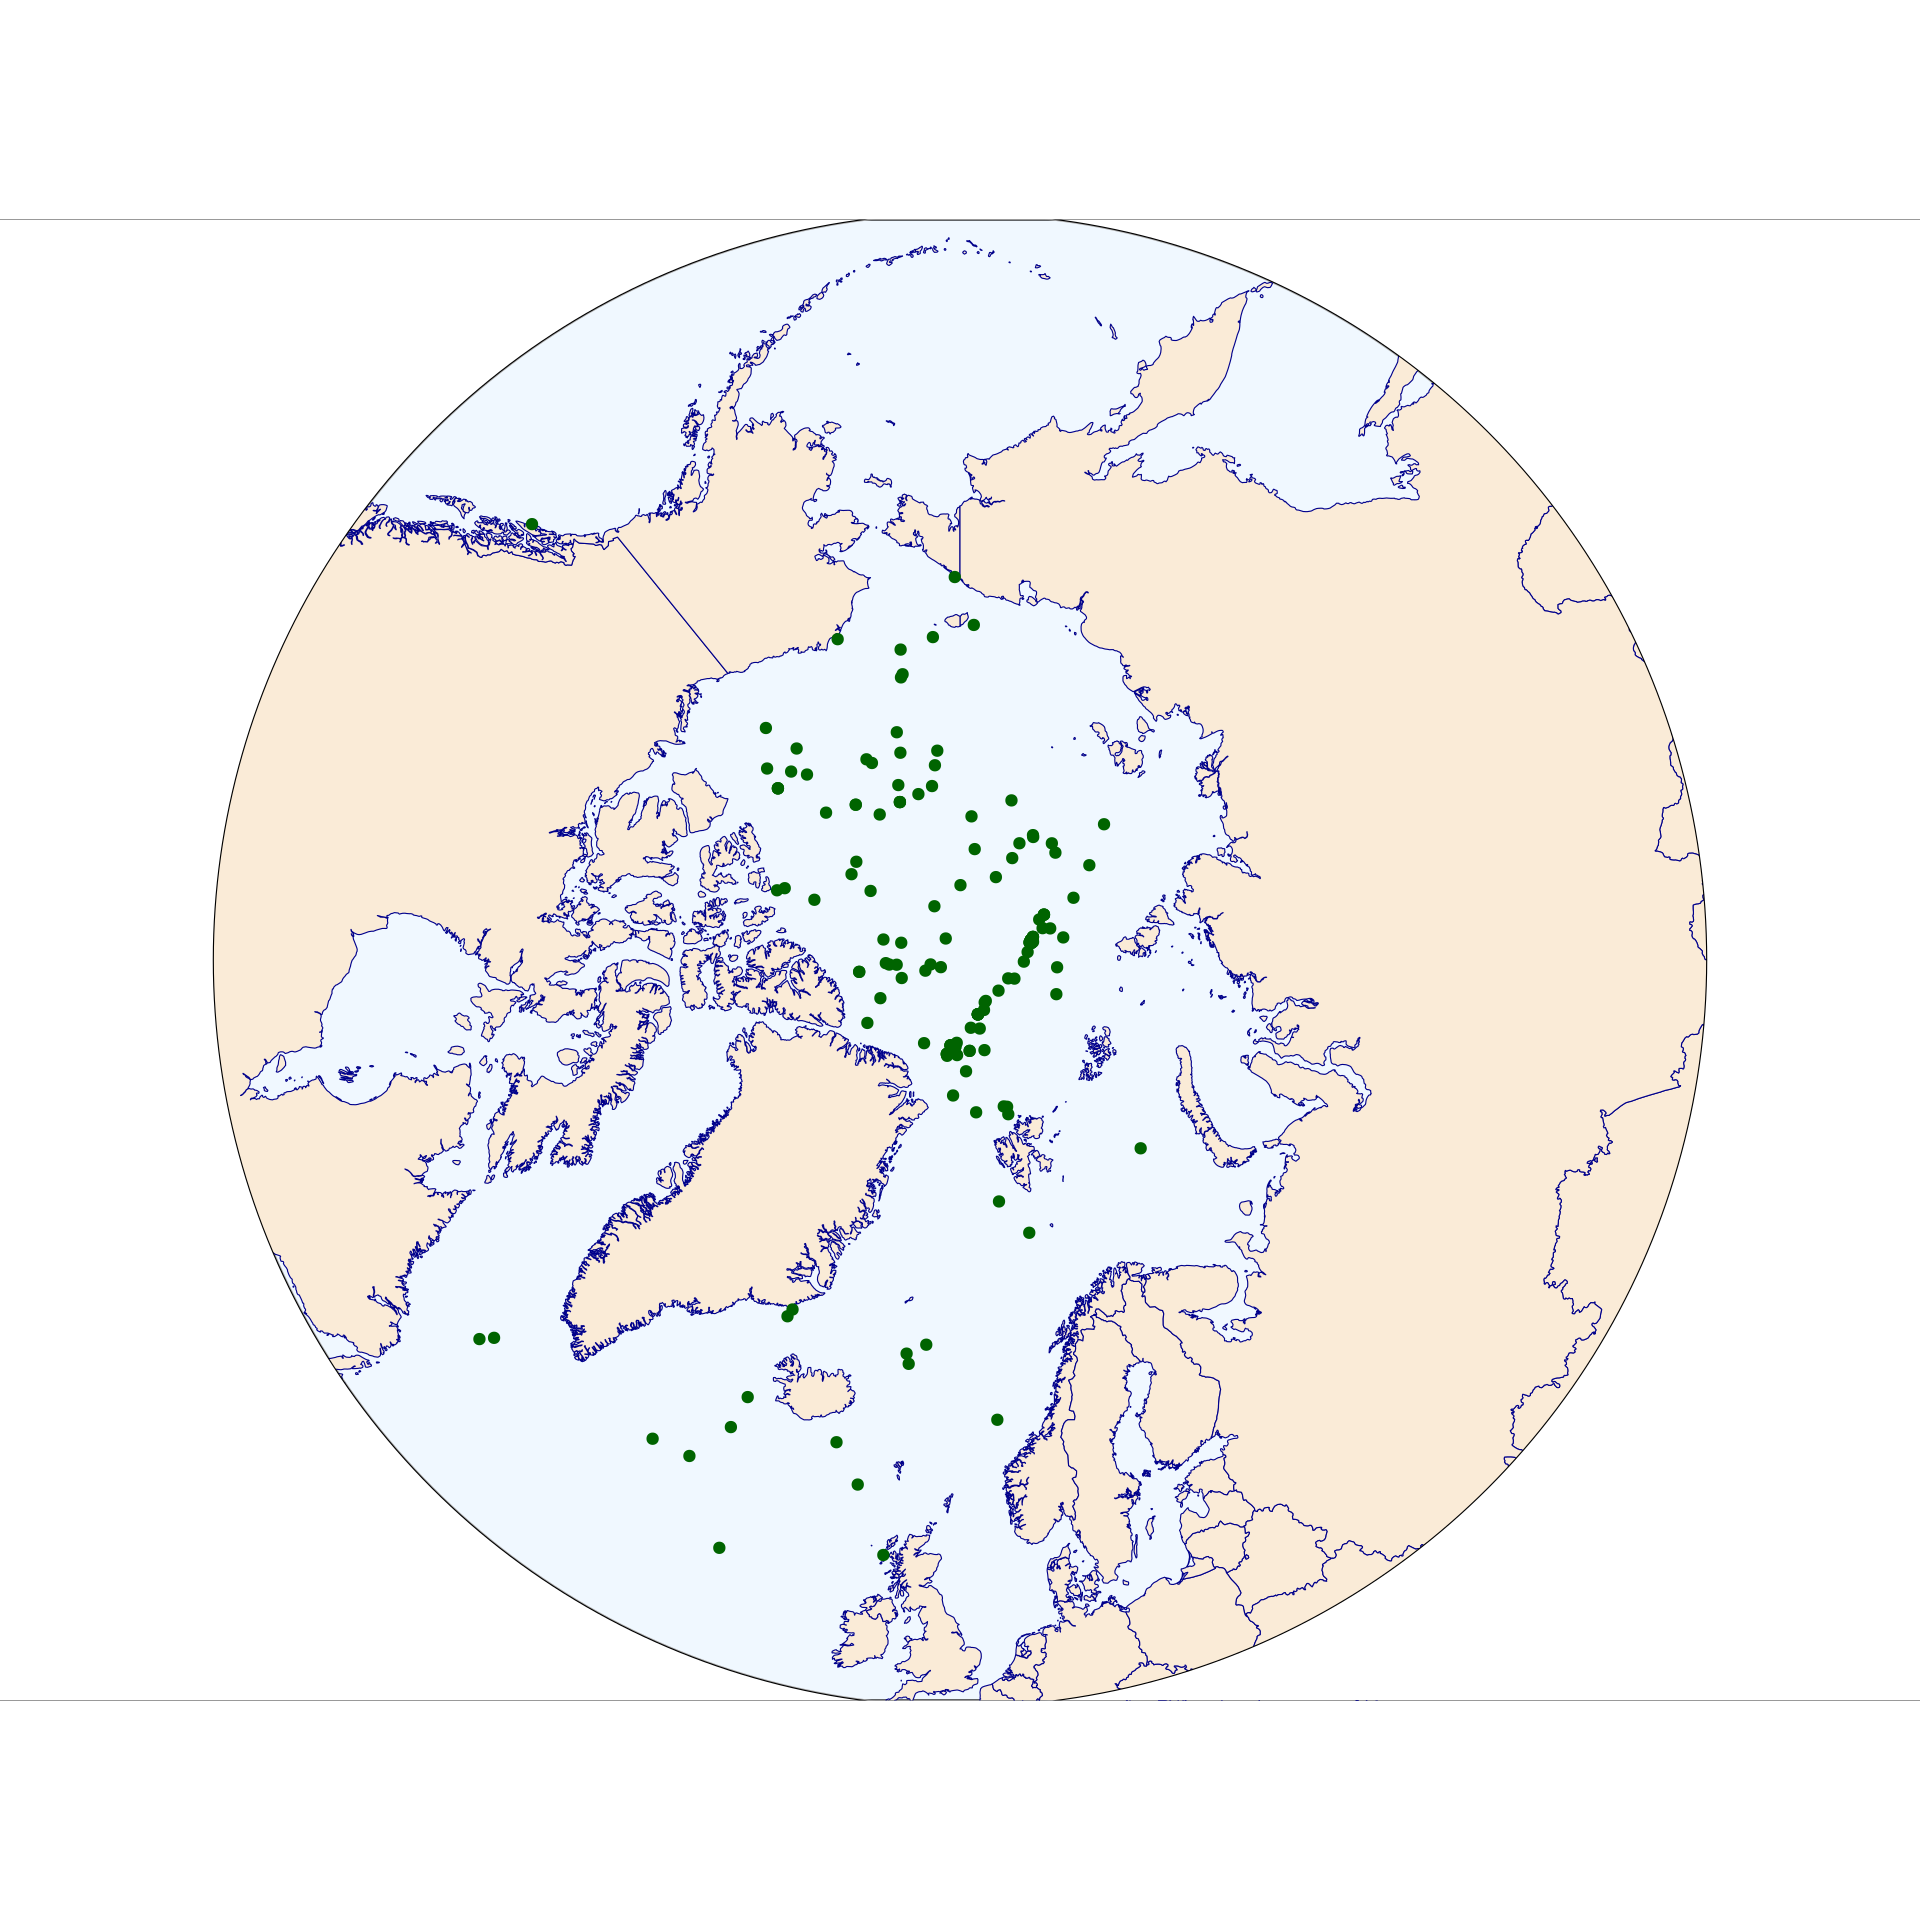
Credits
Buoy data from the International Arctic Buoy Programme (IABP): https://iabp.apl.uw.edu/data.html
Map data from the World Wind Java project: https://github.com/nasa/World-Wind-Java/blob/master/WorldWind/testData/shapefiles/TM_WORLD_BORDERS-0.2Readme.txt